
作品简介
游戏作为一种商品时,会和其它商品一样,其销售数据会受来自各方面因素的影响。其中包括在线玩家数、网络直播推送量、游戏生命周期与评价。游戏越优秀,就能够有更高的评价,同时拥有更多的玩家与网络曝光量。本作品通过Python统计全球最大的游戏平台“Steam”中的价格与折扣数据,并将上述的影响因素的数据列出来。然后找出游戏与价格的数据绘制成统计图,便于直观观看。
采用的Python开发技术
本作品主要采用了Python中的requestts、beautifulsoup、pandas、time、matplotlib等模块。
- requests模块:
requests.get(url=url, headers=headers):获取该页面的源码 - beautifulsoup模块:
BeautifulSoup(r.text, ‘html.parser’):网络上的资源可以通过 html 保存在本地,然后再解析本地 html 文件 - pandas模块:读取与写入表格文件
- time模块:获取当前系统时间
- matplotlib模块:绘制统计图
系统的设计与实现
本系统主要包含爬虫功能以及对影响游戏销售量的各种因素的可视化分析,具体介绍如下。
- 爬虫功能的设计
第一段:使用python爬取了Steam网站中销量前200的游戏的名称、折扣状态、价格和id,并生成“价格信息.xlsx”表格,更加直观观看。
主要源代码如下所示:import requests
1 | from bs4 import BeautifulSoup |
界面如下所示: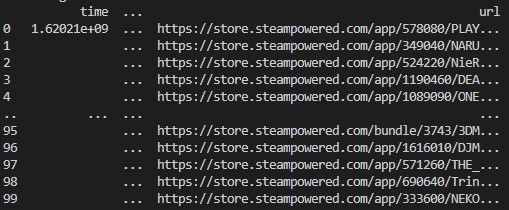
对源代码中的主要代码进行解释。
- 定义一个爬取方法:
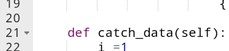
使用浏览器的审查元素功能,找到对应数据的标签:
游戏名爬取:
1 | name = content.find(class_="title").get_text() |
日期爬取:
1 | date = content.find("div",class_="col search_released responsive_secondrow").get_text() |
加入折扣价格爬取:
1 | price= content.find("div",class_="col search_price discounted responsive_secondrow").get_text() |
不加入折扣价格爬取:
1 | price= content.find("div",class_="col search_price responsive_secondrow").get_text() |
链接爬取:
1 | href=content.get("href") |
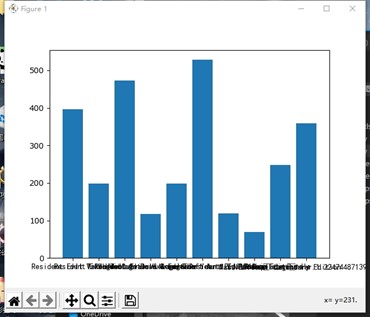
游戏与价格关系的条形图与散点图
柱状图:1
2
3
4
5
6
7
8
9
10
11
12
13from matplotlib import pyplot as plt
games=['Resident Evil Village','It Takes Two','Resident Evil Village Deluxe Edition','Hood: Outlaws & Legends','Hood: Outlaws & Legends - Year 1 Edition','Resident Evil Village & Resident Evil 7 Complete Bundle','Grand Theft Auto V: Premium Edition','Valheim','Mass Effect™ Legendary Edition','NieR Replicant™ ver.1.22474487139...']
price=[396,198,472.36,118,198,528,118.5,70,248,359]
xs=[i+0.1 for i,_ in enumerate(games)]
plt.bar(xs,price)
plt.xticks([i+0.1 for i,_ in enumerate(games)],games,fontproperties="SimHEI")
plt.show()界面如下所示:
散点图
1
2
3
4
5
6
7
8
9
10
11
from matplotlib import pyplot as plt
games=['Resident Evil Village','It Takes Two','Resident Evil Village Deluxe Edition','Hood: Outlaws & Legends','Hood: Outlaws & Legends - Year 1 Edition','Resident Evil Village & Resident Evil 7 Complete Bundle','Grand Theft Auto V: Premium Edition','Valheim','Mass Effect™ Legendary Edition','NieR Replicant™ ver.1.22474487139...']
price=[396,198,472.36,118,198,528,118.5,70,248,359]
plt.scatter(games,price)
labels=['a','b','c','d','e','f','g','h','i','j']
for label,games_count,price_count in zip(labels,games,price):
plt.annotate(label,xy=(games_count,price_count),xytext=(-5,6),textcoords='offset points')
plt.xticks([i+0.1 for i,_ in enumerate(games)],games,fontproperties="SimHEI")
plt.xlabel("games",fontproperties="SimHEI")
plt.ylabel("price")
plt.show()
界面如下所示: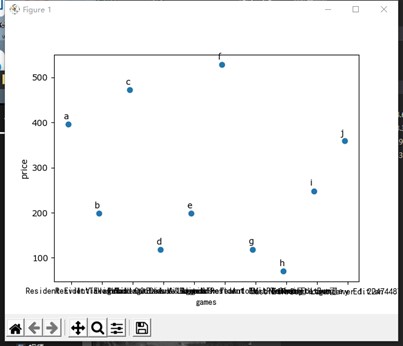
总结
脚本在最初设计阶段时,需要思考各种影响游戏销售的数据并列出来标注出关系。在第二个设计阶段时,我发现最初阶段的很多功能并无法通过现有的技术能力实现,只好保留最有价值的想法。到如今考虑如何通过代码进行实现功能时,我发现python的代码实现数据爬取与可视化并不困难,对于数据进行条形图散点图的统计,通过python代码实现也很简便。
在爬取数据过程中需要一定的html网页知识,我们常用到浏览器中检查元素的功能,对完成爬去模块很有帮助。
最后,通过这次python作品的设计,我学会了许多课堂之外的功能。感受到了python的强大之处。